
Review Statistics
Review Statistics gives you a live view of how much reviewing is happening across your organization, broken down by source, member, repository, and time period.
It counts every Optibot review: pull request and merge request reviews on GitHub and GitLab, and reviews run from the Optibot CLI, the MCP server, the VS Code and Cursor extension, and the API.
Where to Find It
Navigate to Repo Insights → Review Stats in the left sidebar.
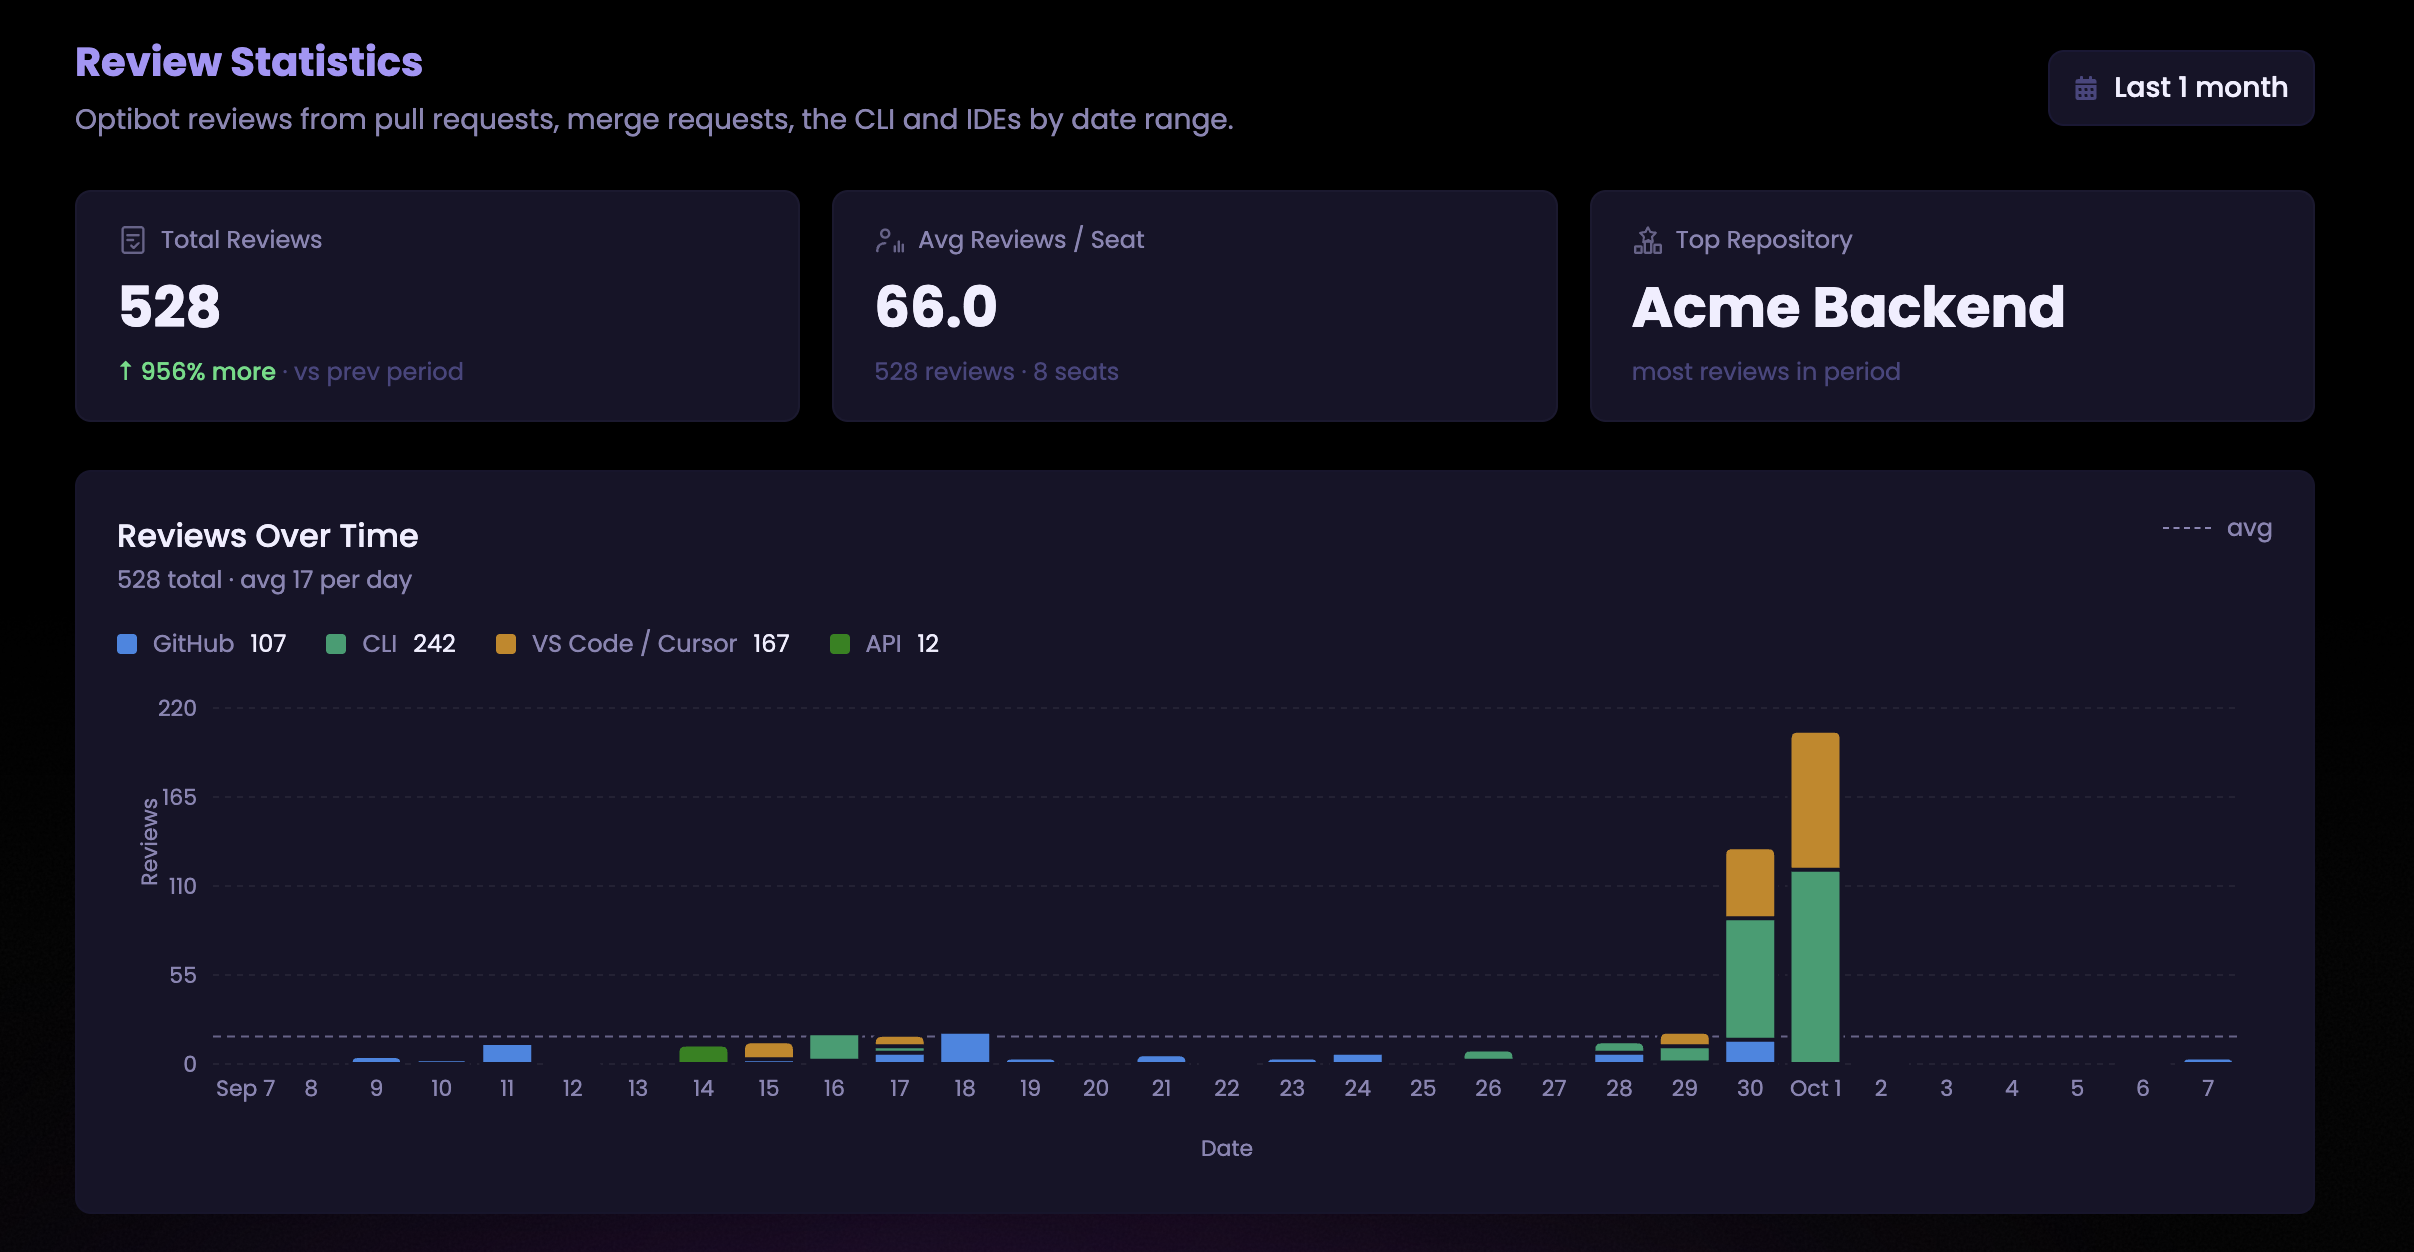
Summary Cards
Three headline numbers appear at the top of the page and update whenever you change the date range:
| Card | What it shows |
|---|---|
| Total Reviews | Number of Optibot reviews completed in the selected period, from every source |
| Avg Reviews / Seat | Total reviews divided by the number of assigned seats, with both numbers shown underneath |
| Top Repository | The repository with the highest review volume in the period |
Total Reviews also shows a percentage change compared to the previous period of the same length. Avg Reviews / Seat has no period comparison, because it uses the seats assigned today. If no seats are assigned, it shows —.
Reviews Over Time
A bar chart shows review volume across the selected date range. Granularity adjusts automatically based on how wide your range is. A dashed reference line marks the average so you can quickly spot periods above or below your normal pace.
Each bar is stacked by where the reviews came from:
| Source | Reviews counted |
|---|---|
| GitHub | Pull request reviews |
| GitLab | Merge request reviews |
| CLI | Reviews run with the Optibot CLI |
| VS Code / Cursor | Reviews run from the editor extension |
| MCP | Reviews run through the Optibot MCP server |
| API | Reviews requested directly through the API |
The legend above the chart shows each source’s total for the period, and hovering a bar shows that bar’s breakdown. Only sources with reviews in the period appear in the legend.
Reviews by Member
A paginated table lists each seated team member alongside their review count for the selected period. Pull request reviews are credited to the pull request’s author, and CLI, MCP and editor reviews to the person who ran them. The member with the most reviews is highlighted with a “Most Active” label.
Search and sort
- Search: filter by member name using the search box in the top-right of the table
- Reviews column: click the column header to toggle between highest-to-lowest and lowest-to-highest order
The rank column (# 1, 2, 3…) is only shown when sorted highest to lowest.
Troubleshooting
| Issue | Fix |
|---|---|
| No data showing | Ensure the date range covers a period when Optibot was active on your repositories |
| Member missing from the table | The table shows seated members only. Check that the member has an assigned Optibot seat in Organization Settings. |
| Member counts add up to less than Total Reviews | CLI, MCP and editor reviews from before October 7, 2026, and reviews of pull requests opened outside your organization, count toward Total Reviews but aren’t credited to a member. |
| No data in the chart | Check that the date range overlaps with when reviews were completed; the chart reflects the same period as the summary cards |